Home»Math Guides»Plot Circles and Ellipses Easily in MATLAB script
How to plot circles and ellipses in MATLAB easily with script M-file
One question we get a lot is how to plot circles and ellipses in MATLAB. You can do so easily by making equations with polar coordinates and using the plot function. If you’re not familiar with how to use polar coordinates, please see our page describing the transformation in more detail.
Use the following code shown below:
hold on
theta = 0:pi/100:2*pi
x = 1*cos(theta) + 0;
y = 1*sin(theta) + 0;
h = plot(x,y);
xlabel('x')
ylabel('y')
hold off
Theta describes how far the circle continues for. It starts at 0, and can go to a maximum of 2*pi. If it has a value over 2*pi, then it repeats from the 0 location again. For example, 3*pi would be a full circle which starts at 0 again, then continues to 1*pi. In our MATLAB code above, the middle part (pi/100) creates in-between values to fill an array so that your plot is not “choppy”, instead your plot will be smooth (your theta goes from 0 to 2*pi, and to do so it increases the points by pi/100 until it hits 2*pi). So all you need to change is either 0 or 2*pi depending on your starting point and endpoint.
In the code above, we also put 1* cos(theta) and 1*sin(theta), the 1 here represents the radius of the circle. As well, the +0 represents horizontal or vertical shifting of the circle, depending on whether it’s a horizontal x shift transformation or a vertical y shift transformation.
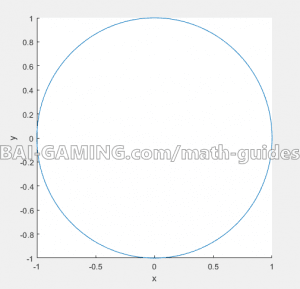
Plotting Circles in MATLAB (centered at the origin)
Example: Plot \({x^2} + {y^2} = 1\) over \(0 \le \theta \le 2\pi \)
Just use the code above. Be careful, to find the radius when given the equation, you actually need to find the root of the right-hand side, meaning that the radius is actually the square root of 1, which is 1 in this case. You might be given =9, then you’d square root it to get a radius of 3, for example.
If you wanted to plot this, but as a hemicircle, you could change to domain to be from 0 to pi for a horizontal hemicircle, or from pi/2 to 3*pi/2 for a vertical hemicircle.
Plotting Circles in MATLAB (centered at a point other than the origin)
Example: Plot \({(x – 3)^2} + {(y – 5)^2} = 25\)
First let’s read the equation to tell us what the circle would look like.
There are arguments in the squared parts, meaning there are horizontal and vertical shifts.
Remember that horizontal shifts are the opposite of their positive/negative sign!
This circle is centered at the point (3,-5) and its radius will be the square root of 25, which is 5.
We modify our script to do this:
hold on
theta = 0:pi/100:2*pi
x = 5*cos(theta) + 3;
y = 5*sin(theta) - 5;
h = plot(x,y);
xlabel('x')
ylabel('y')
hold off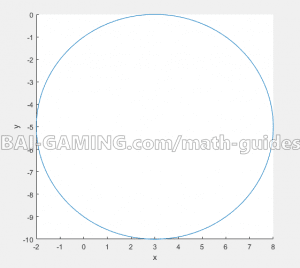
Plotting Ellipses in MATLAB (centered at a point other than the origin)
Let’s take it a step further and do everything at once: ellipsis which is a stretched circle, shifted as well, and a radius other than 1.
Example: Plot \[{\frac{{(x + 4)}}{{25}}^2} + {\frac{{(y – 2)}}{9}^2} = 1\]
First step: Read the equation to know what it looks like.
Square root the terms in the denominator. The origin will be at (-4,-2), remember to reverse the sign of the x shift!
Under the x is the root of 25, which is 5, and under the y is the root of 9, which is 3.
What this means is that the ellipsis’s x-axis goes from -4 plus or minus 5 (so x-axis is from -9 to 1), and the ellipsis’s y-axis goes from -2 plus or minus 3 (so y-axis is from -5 to 1).
NOTE: The right-hand side has =1. You need to have =1 on the right-hand side in order to plot the ellipsis. If you don’t have =1, then you need to divide throughout to be able to get =1.
Then use the following code, note that instead of the radius, put the square rooted denominator values you found instead for the x and y values:
hold on
theta = 0:pi/100:2*pi
x = 5*cos(theta) - 4;
y = 3*sin(theta) - 2;
h = plot(x,y);
xlabel('x')
ylabel('y')
hold off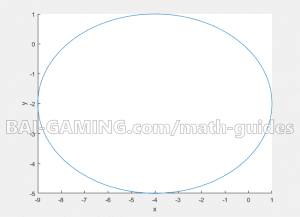
That’s about as difficult as it gets for plotting circles and ellipses!